Monitoring IBM Cloud Pak for Integration components
Operational visibility and the ability to understand the internals of the IBM Cloud Pak for Integration behavior is key to maintaining the health, readiness and availability of the solutions built on top of your Cloud Pak. You can monitor components of your Cloud Pak by leveraging the out of the box monitoring stack provided by the OpenShift Container Platform 4.6+ and enhance its capabilities by deploying the monitoring services provided with the IBM Cloud Pak Foundational Services. This configuration provides a powerful open source based solution that allows you to identify and respond to issues in a timely manner in order to guarantee the level of service and availability of your integrations.
Author:
- James Hewitt: Senior Technical Staff Member / Cloud Pak for Integration
Contributors:
-
Jorge D. Rodriguez: STSM / Business Automation Solutions Architect / Automation SWAT Team
-
Dr. Matthias Jung: Enterprise Content Services / Accelerated Value Specialist / Digital Business Automation - SWAT
-
Kevin Trinh: STSM / Cloud Integration Architect / Digital Business Automation (ECM)
-
Piotr Godowski: STSM / Cloud Pak Foundational Services Architecture
Huge thanks to Jorge who wrote How to Monitor Components of Cloud Pak for Business Automation, which is the basis for this blog post.
Overview
IBM Cloud Pak for Integration is a hybrid integration platform with an automated, closed-loop approach that supports multiple styles of integration within a single, unified experience. Unlock business data and assets as APIs, connect cloud and on-premise applications, reliably move data with enterprise messaging, deliver real-time event interactions, transfer data across any cloud and deploy and scale with cloud-native architecture and shared foundational services — all with end-to-end enterprise-grade security and encryption.
The IBM Cloud Pak for Integration provides a fully integrated platform that combines IBM’s best-in-class integration software to modernise applications and provide new opportunities. The core integration capabilities of the IBM Cloud Pak for Integration include low/no code integration development, first-class API and Event management, message streaming and queuing, and high speed data transfer.
While the integration platform itself provides a low code simplified experience for business and technical users alike, system administrators and operations teams still need to deploy, manage and monitor the containerized software that makes up the IBM Cloud Pak for Integration in order to keep the platform and the solutions built on top running optimally.
In this article I will discuss how to enable monitoring capabilities on the IBM Cloud Pak for Integration and how to extend OpenShift’s pre-configured monitoring stack to provide operational visibility across Cloud Pak components.
Pre-Requisites
- OpenShift Container Platform version 4.6 and up
- IBM Cloud Pak for Integration version 2021.2 and up
- Workstation with
occommand installed
Brief Introduction to the OpenShift Monitoring Stack
The OpenShift Container Platform monitoring stack is based on the Prometheus open source project. At a high level the pre-configured stack includes one or more instances of the following components:
| Component | Description |
|---|---|
| Prometheus | Used to provide a time-series data store for metrics, rule evaluation engine and alert generation. |
| AlertManager | Responsible for alerts handling and notification to external systems. |
| Thanos | Responsible for metric aggregation across Prometheus instances as well as alert generation engine. |
| Grafana | Used to provide dashboard and metric visualization capabilities. This is a read-only instance of Grafana to show platform metrics |
By default, the OpenShift monitoring stack provides monitoring capabilities for core platform components only. That is, the out of the box deployment of the monitoring stack found under the openshift-monitoring project is fully dedicated to monitoring core OpenShift Container Platform systems and other essential kubernetes services.
Optionally, since OpenShift version 4.6, the default monitoring stack deployment can be extended to monitor user-defined projects and custom deployments such as the IBM Cloud Pak for Integration installations. The additional components needed to monitor user-defined projects are automatically deployed under the openshift-user-workload-monitoring project once the default stack is configured to support user-defined projects. After the configuration is completed you will be able to collect, query, visualize and create alerts based on custom metrics generated by your own deployments. This article describes how to enable these capabilities, how to expand them using additional monitoring components provided by the IBM Cloud Pak Foundational Services and how to define the necessary kubernetes resources to collect and utilize custom metrics generated by the IBM Cloud Pak for Integration platform. For more information on how to monitor user-defined projects see the Enabling Monitoring for user-defined Projects documentation.
Enable User Project Monitoring in OpenShift
The first thing that we need to do in order to monitor IBM Cloud Pak for Integration components is to turn on user project monitoring in OpenShift. To do that we need to create an instance of a ConfigMap named cluster-monitoring-config in the openshift-monitoring project. The cluster-monitoring-config ConfigMap allows you to specify the configuration details for the OpenShift monitoring stack such as enabling user project monitoring, retention policy for metrics collected, resource limits for monitoring components, node selectors for pod deployments, among other settings. For a complete list of configurable parameters see Configuring the OpenShift Monitoring Stack.
For the purpose of this article we are going to deploy a simple instance of a ConfigMap that sets the enableUserWorkload attribute to true. Setting the enableUserWorkload to true will enable monitoring for user-defined projects in addition to the default platform monitoring and will automatically trigger the deployment of additional monitoring components under the openshift-user-workload-monitoring project once the ConfigMap is created. To create the cluster-monitoring-config ConfigMap complete the following steps:
- Create a
cluster-monitoring-config.yamlfile. -
Add the following content to the file
apiVersion: v1 kind: ConfigMap metadata: name: cluster-monitoring-config namespace: openshift-monitoring data: config.yaml: | enableUserWorkload: true -
Use the
occommand to create theConfigMapinstanceoc apply -f cluster-monitoring-config.yaml -n openshift-monitoring
Now that the cluster-monitoring-config ConfigMap instance has been created we can verify that the additional components required for user project monitoring have been deployed under the openshift-user-workload-monitoring project. You can use the following command to list the PODs under the openshift-user-workload-monitoring project. Wait until the pods are running and ready.
oc get pods -n openshift-user-workload-monitoring
Once the additional monitoring components have been deployed successfully the output of the command should look similar to the following listing:
NAME                                        READY   STATUS    RESTARTS   AGE
prometheus-operator-5d66498b6-tgwhv         2/2     Running   0          2d4h
prometheus-user-workload-0                  4/4     Running   0          2d4h
prometheus-user-workload-1                  4/4     Running   0          2d4h
thanos-ruler-user-workload-0                3/3     Running   0          2d4h
thanos-ruler-user-workload-1                3/3     Running   0          2d4h
To customize the resources and the behavior specific to monitoring components deployed under the openshift-user-workload-monitoring project, you can create a ConfigMap named user-workload-monitoring-config under that project. This ConfigMap is analogous to the cluster-monitoring-config created under the openshift-monitoring project and allows you to further customize the deployment of components specific to user project monitoring. See Configuring the monitoring stack for additional details.
Configure Monitoring Services in the IBM Cloud Pak Foundational Services
While the OpenShift monitoring stack provides most of the capabilities required to properly address observability and operational visibility requirements for your Cloud Pak, there are some limitations around the ability to visualize metrics. Specifically, the Grafana instance included in the OpenShift core monitoring stack is read only. This means that you can only visualize a predefined set of metrics through pre-configured dashboards provided by the platform. This also means that the ability to create new dashboards and visualize custom metrics has been completely removed from this installation.
Fortunately, the IBM Cloud Pak Foundational Services, installed as part of the IBM Cloud Pak for Integration, makes it easy to deploy an additional instance of Grafana that is fully functional and that is connected to the OpenShift’s Prometheus instance. This configuration gives us the ability to use all metrics available in the platform, including custom metrics, so that we can create additional visualizations and dashboards on top of what is provided by the OpenShift user-defined workload monitoring stack.
Although the IBM Cloud Pak Foundational Services are installed as part of your IBM Cloud Pak For Integration installation, the monitoring services that include Grafana might not be installed. To verify that Grafana was installed as part of your Cloud Pak deployment you can run the following command:
oc get pods -n ibm-common-services -l app.kubernetes.io/managed-by=ibm-monitoring-grafana-operator
If Grafana is installed as part of the IBM Cloud Pak Foundational Services you should see an output similar to the following listing:
NAME                                             READY   STATUS    RESTARTS   AGE
ibm-monitoring-grafana-78b9cd8688-xxq5q          4/4     Running   0          3d14h
ibm-monitoring-grafana-operator-54cbd464d-xqq82  1/1     Running   0          3d14h
If Grafana is not installed we can configure the monitoring services that are part of the IBM Cloud Pak Foundational Services to deploy an instance. The steps provided below assume that the IBM Cloud Pak Foundational Services are already installed on your cluster. To verify if the IBM Cloud Pak Foundational Services are installed you can run the following command:
oc get pods -n ibm-common-services -l app.kubernetes.io/managed-by=ibm-common-service-operator
If the IBM Cloud Pak Foundational Services are installed the output of the command should be similar to the following listing:
NAME                                           READY   STATUS    RESTARTS   AGE
ibm-common-service-operator-84c9d8cc69-zsgxw   1/1     Running   0          3d15h
If the IBM Cloud Pak Foundational Services are not installed on your system you cannot complete the remaining steps in this section. As already mentioned, the IBM Cloud Pak Foundational Services will be installed automatically once you install the IBM Cloud Pak for Integration, so come back to this section once your Cloud Pak is installed. See the IBM Cloud Pak Foundational Services documentation for additional information on these services.
Deploying grafana using the Platform UI
The IBM Cloud Pak for Integration Platform UI can be configured to install the IBM Cloud Pak Foundational Services monitoring components for you.
-
Open the OpenShift console.
-
In the side bar, select Operators > Installed Operators.
-
Select the project for your IBM Cloud Pak for Integration Platform UI installation.
-
Select IBM Cloud Pak for Integration from the list of operators.
-
Select the Platform UI tab.
-
Select your instance from the list.
-
Select the YAML tab.
-
Add
monitoringto therequestIbmServicessection.spec: requestIbmServices: monitoring: true -
Click Save.
-
Wait for services to install. This could take up to 30 minutes depending on how many other components are being updated or installed. Use the following command to monitor the installation.
oc get pods -w -n ibm-common-services -l app=grafanaOnce the installation is completed successfully you should see output similar to the following:
NAME                                      READY   STATUS           RESTARTS   AGE
ibm-monitoring-grafana-797c5d4c5f-nxt8c   0/4     Pending          0          0s
ibm-monitoring-grafana-797c5d4c5f-nxt8c   0/4     Pending          0          0s
ibm-monitoring-grafana-797c5d4c5f-nxt8c   0/4     Init:0/1         0          3s
ibm-monitoring-grafana-797c5d4c5f-nxt8c   0/4     Init:0/1         0          26s
ibm-monitoring-grafana-797c5d4c5f-nxt8c   0/4     Init:0/1         0          26s
ibm-monitoring-grafana-797c5d4c5f-nxt8c   0/4     PodInitializing  0          29s
ibm-monitoring-grafana-797c5d4c5f-nxt8c   1/4     Running          0          54s
ibm-monitoring-grafana-797c5d4c5f-nxt8c   2/4     Running          0          69s
ibm-monitoring-grafana-797c5d4c5f-nxt8c   3/4     Running          0          71s
ibm-monitoring-grafana-797c5d4c5f-nxt8c   4/4     Running          0          78s
Notice that the
ibm-monitoring-grafana-xxxxxxxxx-xxxxxpod has multiple containers. All of these containers should report Ready for the installation to be considered complete.
Deploying grafana using IBM Cloud Pak Foundational Services directly
Having verified that the IBM Cloud Pak Foundational Services are deployed in your cluster, we can customize that deployment to include Grafana based services. The Grafana based services are deployed and managed by the IBM Monitoring Grafana Operator. This operator can be installed using the Operand Deployment Lifecycle Manager framework that is part of the foundational services. To install the IBM Monitoring Grafana Operator:
-
Create a
grafana-operand-request.yamlfile. -
Add the following content to the file:
apiVersion: operator.ibm.com/v1alpha1 kind: OperandRequest metadata: name: common-service namespace: ibm-common-services spec: requests: - operands: - name: ibm-monitoring-grafana-operator registry: common-service -
Deploy the
OperandRequestinstance using theoc applycommand. Running this command might trigger the installation or update of additional components within the IBM Cloud Pak Foundational Services.oc apply -f grafana-operand-request.yamlThe output of the command should be similar to the following listing:
operandrequest.operator.ibm.com/common-service createdIf the approval strategy for operators has been changed to Manual, the install plan for the operator must be approved for installation to actually happen.
-
Wait for services to install. This could take up to 30 minutes depending on how many other components are being updated or installed. Use the following command to monitor the installation.
oc get pods -w -n ibm-common-services -l app=grafanaOnce the installation is completed successfully you should see output similar to the following:
 NAME                                      READY   STATUS           RESTARTS   AGE
 ibm-monitoring-grafana-797c5d4c5f-nxt8c   0/4     Pending          0          0s
 ibm-monitoring-grafana-797c5d4c5f-nxt8c   0/4     Pending          0          0s
 ibm-monitoring-grafana-797c5d4c5f-nxt8c   0/4     Init:0/1         0          3s
 ibm-monitoring-grafana-797c5d4c5f-nxt8c   0/4     Init:0/1         0          26s
 ibm-monitoring-grafana-797c5d4c5f-nxt8c   0/4     Init:0/1         0          26s
 ibm-monitoring-grafana-797c5d4c5f-nxt8c   0/4     PodInitializing  0          29s
 ibm-monitoring-grafana-797c5d4c5f-nxt8c   1/4     Running          0          54s
 ibm-monitoring-grafana-797c5d4c5f-nxt8c   2/4     Running          0          69s
 ibm-monitoring-grafana-797c5d4c5f-nxt8c   3/4     Running          0          71s
 ibm-monitoring-grafana-797c5d4c5f-nxt8c   4/4     Running          0          78s
Notice that the
ibm-monitoring-grafana-xxxxxxxxx-xxxxxpod has multiple containers. All of these containers should report Ready for the installation to be considered complete. -
Now that Grafana has been installed we need to find the URL that we can use to access the services. The Grafana instance deployed through the IBM Foundational Monitoring Services is accessed via a common Cloud Pak route called
cp-console. To find the details of thecp-consoleroute you can run the following command:oc get route -n ibm-common-services cp-consoleThe output of the command should look similar to the following listing:
     NAME         HOST/PORT                           SERVICES                 PORT    TERMINATION          WILDCARD
     cp-console   cp-console.<cluster-subdomain>      icp-management-ingress   https   reencrypt/Redirect   None
The full URL to access the cp-console route is as follows:
https://cp-console.<cluster-subdomain>/Where
<cluster-subdomain>the the ingress subdomain assigned to your cluster. -
To access the Grafana dashboard enter this URL in your browser. You will be taken to the Cloud Pak authentication page. Select the OpenShift as the authentication type to be taken to the Cloud Pak Administration Hub using OpenShift Credentials.
-
Click Menu (top left icon) > Monitoring. Note: Alternatively, you can open
https://cp-console.<cluster-subdomain>/grafanadirectly to access the Grafana Dashboard.
Monitoring Capabilities at the component level in the IBM Cloud Pak for Integration
The IBM Cloud Pak for Integration components automatically enable monitoring capabilities at the component level. The components automatically advertise their metrics endpoints to the OpenShift user project monitoring stack.
Access the Cloud Pak for Integration sample dashboards
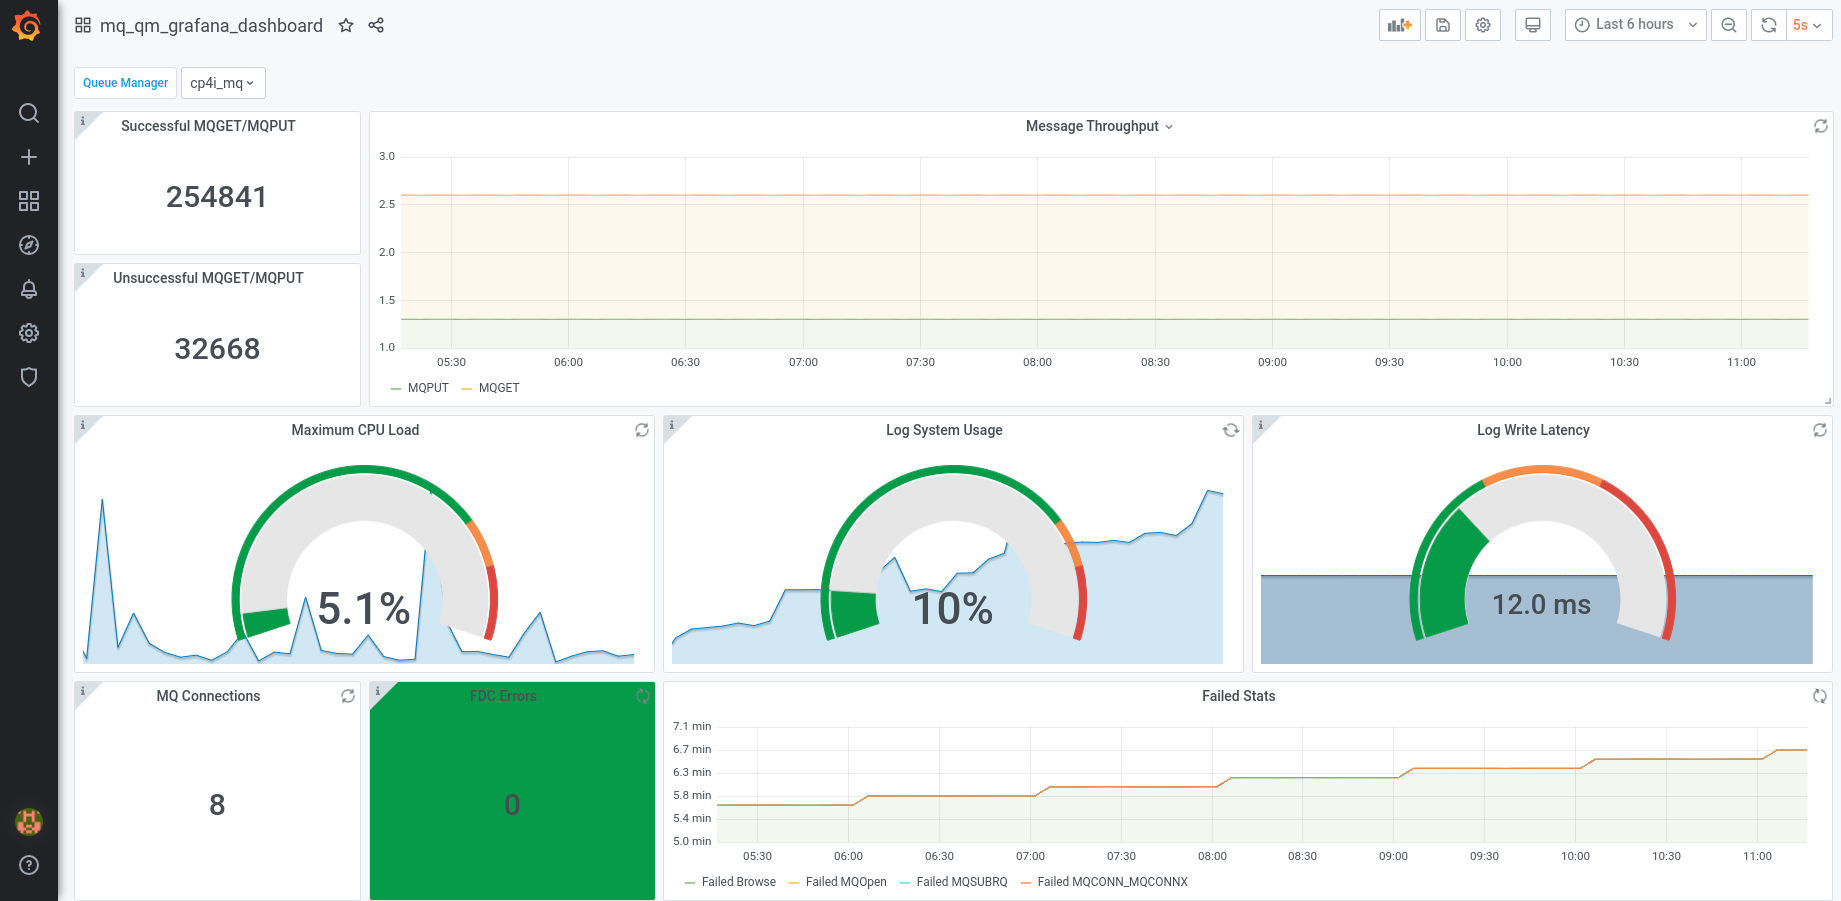
Now that we have installed IBM Cloud Pak for Integration, and deployed a fully functional instance of Grafana, we can use the sample dashboards to visualize some of the metrics generated by IBM Cloud Pak for Integration components. You can create or edit dashboards directly from the Grafana user interface, and automate the deployment of dashboards by using MonitoringDashboard custom resources.
Access the dashboards from the IBM Cloud Pak for Integration platform UI
-
Open the platform UI in a browser.
-
Select the navigation menu, and go to the Administration section, then Integration Instances.
-
Select the 3 button menu next to the integration you want to monitor, and select the Monitoring link. Only components that have dashboards available will show a Monitoring link.
Access the dashboards within Grafana directly
-
Access your new Grafana instance using the URL off the cp-console route. See the previous section on how to access the Grafana dashboard. As stated before the URL should have the following format:
https://cp-console.<cluster-subdomain>/grafana -
Click on the Settings icon, found on the lower left-hand side of the screen (above the help “?” icon). This will take you to the settings panel for the user that is currently authenticated in Grafana.
-
Go to the Organizations section under the Settings page and look for the namespace where your IBM Cloud Pak for Integration components are deployed. Once you find the organization, click on the Select button next to it. This will switch the context used by Grafana so that it can find your Dashboard under that organization. Note: You will only be able to see Grafana organizations corresponding to the OpenShift projects that your user has access to. For more information on role-based access controls for the Grafana instance included in the IBM Cloud Pak Foundational Services see Monitoring Service
-
Click on the Dashboards menu, depicted by the four squares icon, to the left of the screen and select the Manage option. You should be able to see the dashboards listed for your installed IBM Cloud Pak for Integration components.
-
Click on a dashboard. You should see the selected dashboard.
You can now explore all custom metrics available via the IBM Cloud Pak for Integration components and expand the dashboard capabilities to include visualizations for additional metrics and components suited to your use case.
Note: There is a set of Grafana dashboards included by default in the IBM Cloud Pak Foundational Services. You can access these dashboards by selecting the Main Org. organization under the Settings panel and accessing the Dashboards menu as explained above.
Configure Alerts Based on IBM Cloud Pak For Integration Components
Arguably one of the most important features of a monitoring system is the ability to generate notifications based on conditions or events that need to be investigated in order to prevent or address application issues and potential failures. The OpenShift Container Platform leverages the combined capabilities of Prometheus, Thanos and AlertManager to generate, correlate and route notifications to a variety of notification targets.
In previous sections of this article we were able to configure OpenShift’s monitoring stack to support user-defined projects and feed custom metrics generated by IBM Cloud Pak for Integration components into it. In this section we will learn how to leverage this setup in order to create customized alerts to monitor the behavior of the Cloud Pak. Specifically, we will create a sample alert to monitor the message throughput of an MQ queue manager.
To define a custom alert in the OpenShift’s monitoring stack we need to create an instance of the PrometheusRule custom resource definition. This entails creating a resource of type PrometheusRule and specifying the rules that would trigger the firing of notifications using the Prometheus expression language.
- Create a file
cp4i-mq-throughput-alert.yaml. -
Add the following content to the file:
 apiVersion: monitoring.coreos.com/v1
 kind: PrometheusRule
 metadata:
   name: cp4bi-mq-throughput
   namespace: <cp4i_namespace>
 spec:
   groups:
   - name: cp4isetup
     rules:
       - alert: cp4i-mq-throughput-low
         expr: rate(ibmmq_qmgr_mqput_mqput1_total{qmgr="<queue manager>"}[5m]) < 1
         for: 10m
         labels:
           severity: warning
         annotations:
           message: Potential throughput problem - queue manager is receiving no messages
Where
<cp4i_namespace>should be replaced with the name of the project where the IBM Cloud Pak For Integration has been deployed and<queue manager>should be replaced with the name of the queue manager to monitor. -
Deploy the PrometheusRule instance using the
oc applycommandoc apply -f cp4i-mq-throughput-alert.yamlThe output of the command should be similar to the following listing:
prometheusrule.monitoring.coreos.com/cp4i-mq-throughput created -
Verify the alert has been created
oc get PrometheusRule cp4i-mq-throughput -n <cp4i_namespace>Where
<cp4i_namespace>should be replaced with the name of the project where the IBM Cloud Pak For Integration has been deployed.The output of the command should be similar to the following listing:
 NAME                 AGE
 cp4i-mq-throughput   18m
To validate if your PrometheusRule instance has been properly created, you can use the OpenShift Console. From the OpenShift Console you can inspect the rule created and verify if the alert is actually being fired. For example, we can verify the cp4i-mq-throughput alert created above by completing the following procedure:
-
Open the Administrator perspective of your OpenShit Console.
-
Go to the Monitoring menu on the left-hand side of the console.
-
Select the Alerting option under the Monitoring menu.
-
By default, the Alerting panel shows platform based alerts (those monitoring OCP components and Kubernetes) that are being fired. You can expand the search to include non-platform alerts by clicking on the Clear all filters link. When all filters are removed, you should be able to see alerts that are part of the platform and custom alerts coming from user-defined projects. Notice that this panel does not show the actual instance of the
PrometheusRulecreated in the previous step. It shows instances of alerts that are actively being fired or about to be fired when the conditions of thePrometheusRuleare met. If you do not see an alert in this panel it means that the conditions for the alert have not been met. -
To view the actual instance of the
PrometheusRulepreviously created in this section you can click on the Alerting Rules tab found at the top of the Alerting panel. By default, the Alerting Rules panel only showsPrometheusRuleinstances for the platform but you can click on the Clear all filters link to include alert rules for user-defined projects. Once you clear all filters you should be able to see thecp4i-mq-throughputalert rules.
As you can see, creating alerts for components of the IBM Cloud Pak for Integration can be done using the standard mechanism provided by Prometheus to create custom alerts. A few things worth mentioning about these capabilities are:
- Once custom metrics have been scrapped by Prometheus you can use them to create alert rules. This gives you the flexibility to create alerts that are specific to the capabilities and inner workings of the IBM Cloud Pak for Integration components and to get real-time notifications based on potential threats to the reliability of your solutions.
- Custom metrics can be used in combination with functions provided by Prometheus to test for a condition. In this example, we used the rate function to calculate the rate of change of messages being put onto an MQ queue manager.
- The instance of your alert resource should be created under the namespace where the resource being monitored resides. Since we were monitoring the IBM Cloud Pak For Integration we created the alert in that namespace.
For a complete explanation of how to create alerts and the Prometheus expression language see the Alerting Rules documentation.
Conclusion
Operational visibility and the ability to understand the internals of the IBM Cloud Pak for Integration behavior is key to maintaining the health, readiness and availability of the solutions built on top of your Cloud Pak. You can monitor components of your Cloud Pak by leveraging the out of the box monitoring stack provided by the OpenShift Container Platform 4.6+ and enhance its capabilities by deploying the monitoring services provided with the IBM Cloud Pak Foundational Services. This configuration provides a powerful open source based solution that allows you to identify and respond to issues in a timely manner in order to guarantee the level of service and availability of your integrations.
Want to start your agile integration journey? See how the IBM Cloud Pak for Integration can help you.